In 2010 I built one of the most advanced charting libraries available for Windows, Visiblox. Originally I was pretty certain it would mostly be finance companies using this component in their applications. That was until I found out that one of the biggest oil rigs used these charts to build their mission critical drill monitoring system.
Where It All Started
In 2010, while working at Scott Logic, a financial consultancy, we noticed that a lot of the banks we were working with all wanted better charting solutions. Almost all of our clients wanted to display tens of thousands of data points in their apps. At the time the existing off-the-shelf components were great to create pretty charts... but couldn't handle more than a couple hundred data points without long load times or jerkiness.
So we decided to fill this niche: let's build high-performance charts that can display millions of data points and zoom in and out instantaneously. While we're at it, might as well make it ridiculously extensible. Like... allowing to add any number of axes to the charts and restyle every element to your heart's content.
We built a prototype in a month, got feedback, then shipped the v1 publicly in 6 months. Our financial clients loved it and we had a few other companies purchase licenses as well.
The Call from Texas
A couple of months after launch we got a call from Texas asking for technical support on our charts. Some developers were trying to implement charts with multiple X axes. Sure enough, our chart supported this in theory - even though I've not seen anyone have a use case for doing this in practice. So out of curiosity I asked what their use case was. It was this:
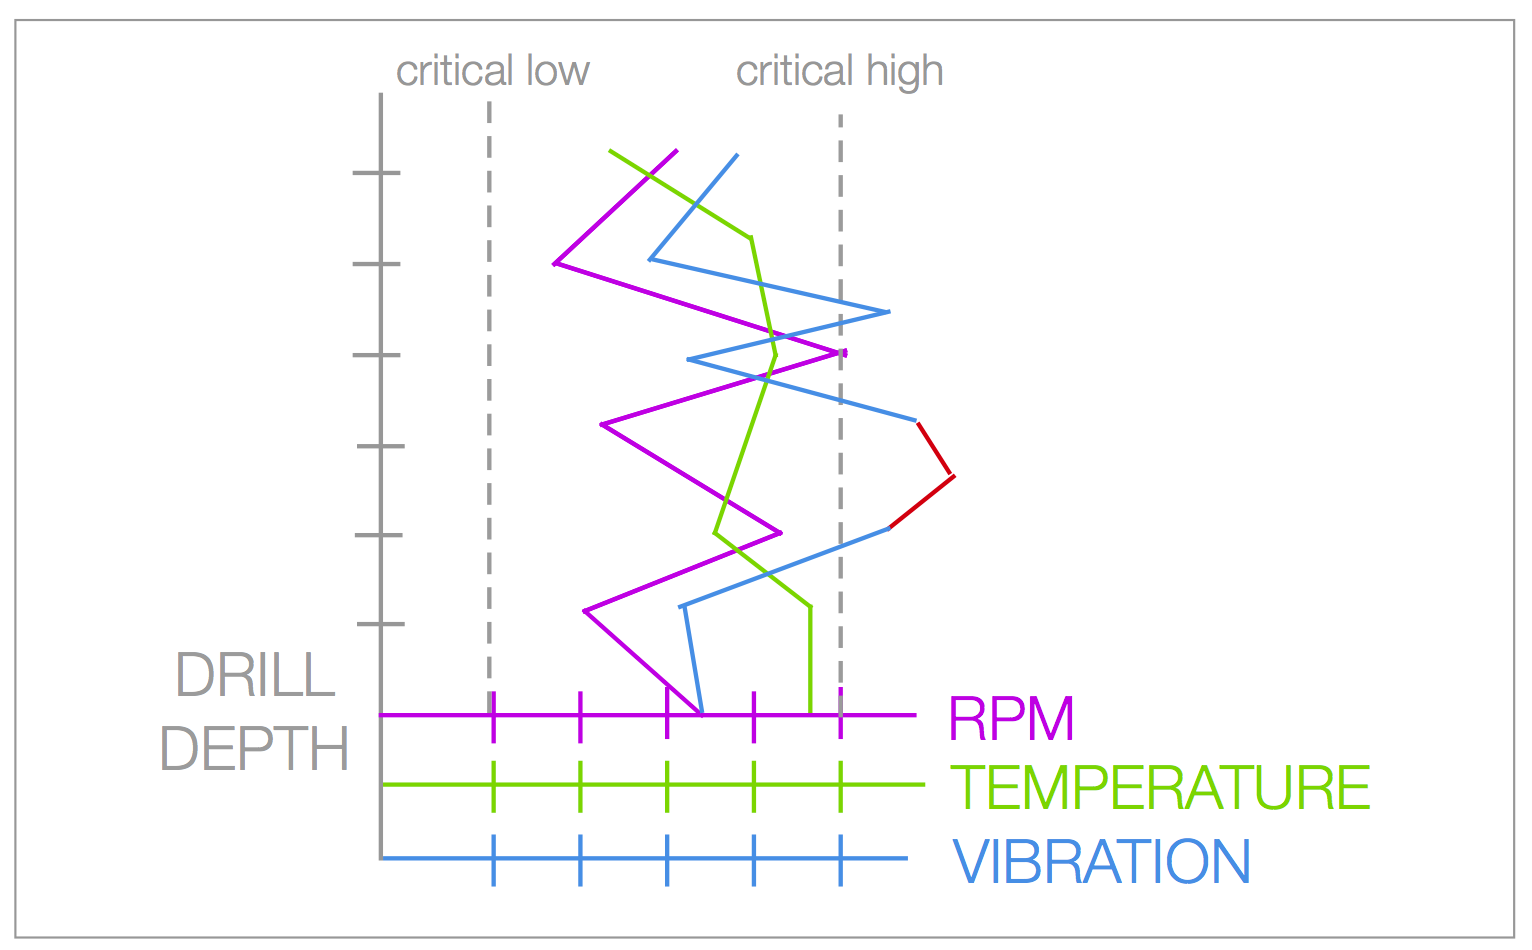
I started to get interested. Drill depth? RPM? Vibration? Where would this stuff be running? I asked the guys where this stuff would be deployed. Helpful enough they showed me. It will be running on one of these monitors:
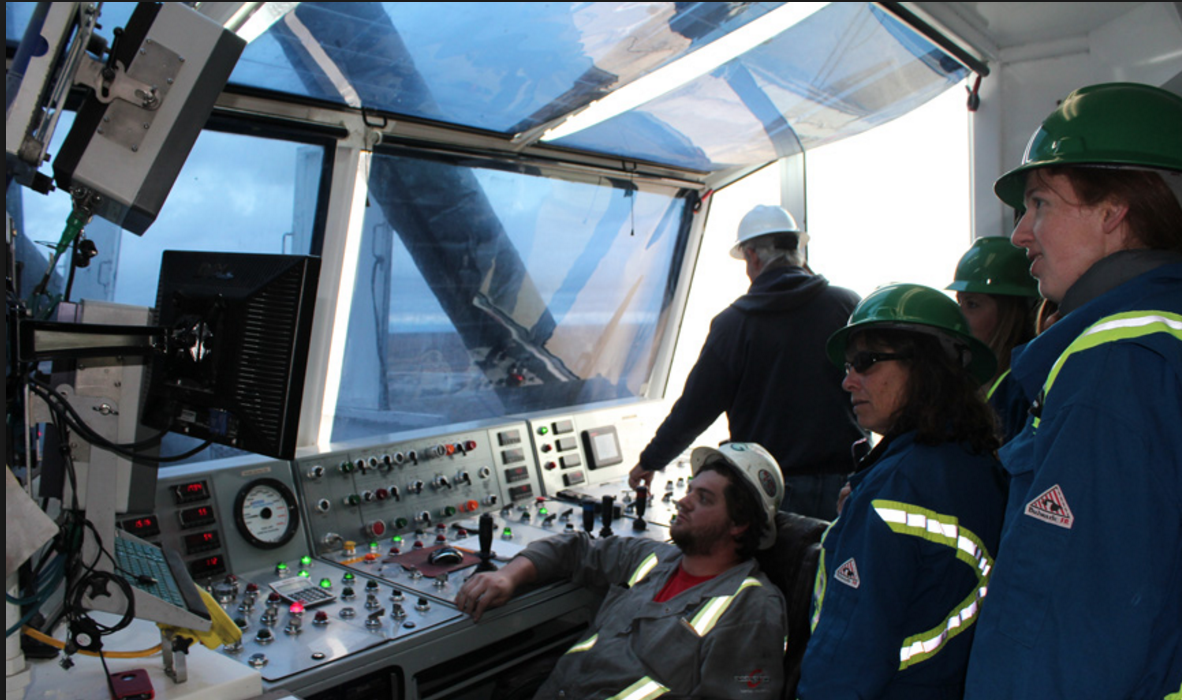
On one of the biggest oil rigs, monitoring the in progress drill operations:

And that was the moment I realised: wow, my code is actually doing some real world stuff!
Five Things I Learned From The Oil Rig Devs
The next few weeks I worked closely to finish implementation of the monitoring component with the devs on the oil rig, before it was deployed in production (and still running, if I'm not mistaken). Here are 5 things that I've learned from my code making it to power the oil rig's monitoring system.
1. Give Devs Advanced Tools and They'll Surprise You With Even More Advanced Stuff
We built the charts component as a tool or SDK for developers to incorporate into their apps. We had a few advanced use cases in mind, such as being able to zoom in and out with millions of data points, as well as charts with multiple Y axes.
We knew we couldn't cover all possible use cases so made the charts as extensible as possible - being able to add and style any number of axes, plot your own series and so on. We did some wacky experiments in-house of just how customizable the charts were.
However nothing surprises you as much as real world use cases. To date, I've never seen such a complicated - and very valid - use case of using a chart with multiple X axes, and the Y axes cleverly monitoring the depth of the drill.
2. Mission Critical Systems Don't Build it All From Scratch
The devs on the oil rig had an existing custom built charting component in place beforehand - however it became more and more difficult for them to maintain. This is why they looked around for alternatives - and found the charts library I was building.
It was cheaper and easier for them to not have to deal with the implementation details of rendering the charts. Instead, they leveraged a tool that took care of all of these details. For them even though the charting UI was a very important part of the system, it was a better tradeoff to take a tool, test it and integrate it, rather than build it from scratch.
If you build a reliable tool that significantly reduces the amount of work needed to be done, then devs will use this tool, regardless of the industry and how mission critical the system is. (They will obviously be pragmatic about it: the more mission critical part of the system we're talking about, the more likely they'll consider implementing it in-house.)
3. Memory Leaks Are Complete Showstoppers In Mission Critical Systems
One of the first measurements the devs did were around performance and memory leaks. And this is perfectly understandable: when you're building a system that needs to run continuously for or months, it's super important performance stays stable. Even more important that the app doesn't run out of memory.
Turns out memory leaks and performance degradations have a very strong one-way correlation. If there is a memory leak in the code, it will almost certainly cause performance degradation. And of course, after a while it will result in the app running out of memory and crashing.
On Visiblox we spent tons of time tracking down all memory leaks - and kept measuring different scenarios to make sure memory footprint stayed stable at all times. Of course, performance degradations can happen for a variety of other reasons then memory leaks, but whenever building long running apps where crashes are not acceptable, do your homework on memory leaks.
4. To Succeed in a Mature Market Your Product Needs to Be 10x Better than the Competition
The motivation to create (yet) another charting library came after many of our clients expressed their frustration with the existing charting components. However before we even decided to start working, we tried every single charting library, mapping the market.
The WPF charting market at this stage was pretty mature, with about 15 decent charting libraries available, many of them having been developed for 3-4 years. The niche we discovered was that none of the libraries could render more than 500 data points without taking too long to load or being jerky. But would providing a solution to just this performance problem be enough to get traction?
We knew no one would invest time and effort integrating our library unless we gave them a compelling reason to do so. A lesson I took away from Visiblox is that to be able to succeed in a mature market, your product needs to be at least 10x as good as existing alternatives in more than one area. If your product is just a little bit better in a few areas, then people won't bother investing time and effort to switch.
The story we had was that we could seamlessly display 2,000x as many points as our competitors and give you unrivaled extensibility. Turns out the oil rig developers only decided to switch because our component gave them both of these advantages that were massively better than other alternatives on the market.
5. High-Performance Software Utilizes the Language, Framework and Platform to its Limits
When development of Visiblox started we didn't dive in straight with coding but did proper planning, prototyping, research and measuring to decide how to tackle the problem of building high-performance charts.
What is the maximum number of points that we can store in memory and how much space will one single point take? Should we use classes with an 8-12 byte memory overhead or just go with structs? If we use structs, will be limited to the size of the stack or will the C# VM still allocate data on the heap?
What is the fastest way to draw lots of points in WPF? Should we manipulate bitmaps, is using Canvas feasible or are there other viable alternatives? How do the different approaches work when implementing zooming? Before choosing any of the approaches we built prototypes for each solution, measuring their execution speed, memory overhead and debating their complexity. [2]
After doing our homework on deciding the approaches coding the first version was much easier than I expected: a first, working version was ready in about a month with pretty good performance already. However to build software that was pretty well optimized for performance we needed to know limits of the language, framework and platform really well.
Your Code Will Be Used In Unexpected Ways - But Only If You Release It
It was a great feeling that from thousands of miles away and with no actual knowledge of how oil rigs work, I actually helped make an offshore platform run better (or at least make their charts prettier).
Building stuff that's not consumer facing sometimes doesn't feel as sexy - Visiblox for example, isn't as cool to show off to my friends as one of my side projects, Cocktail Flow. However in many ways building tools for devs can be just as fun and rewarding.
And it's not just by building SDKs or components you can enable other devs to create something even more amazing. The easiest way to give a fellow engineer a chance to surprise you: publish some of your code to so others can reuse it, for example on Github - like I did with the theme of my blog.
Notes
[1] - Visiblox to date is still the most performant WPF & Silverlight charting library. The same team behind this library also created Shinobi Charts for iOS and Android which is a similarly superb SDK to use in any app - not just for oil rigs.
[2] - We ended up using Canvas over bitmaps. Drawing on bitmaps are much faster, however it's really complex to implement zooming, which in return is very trivial using a Canvas. We ended up re-using points (and moving unused points offscreen) as adding and removing points to a canvas turned out to be a very large performance overhead.